The model visualization environment KINO / VISUMOD was developed to simplify the model analysis of complex models. KINO and VISUMOD animate results from hydrographical numerical models. Two different storage formats for the data are possible, the "integer" format and the "real" format. During the creation of a new scenario you can choose weather the data should be stored in the "real" or the "integer" format. If the data is stored in the "integer" format, it only needs half of the space of the hard disk as the same data stored in the real format. The animation is a little bit faster with a math coprocessor and much faster without it. On the other hand, all of the statistical and the extract functions of the program are not available by using the data in the "integer" format. For the usage for these functions the program needs the data in the "real" format. During the animation the colormap and the speed can be changed and it is possible to show the topography of the underlying model.
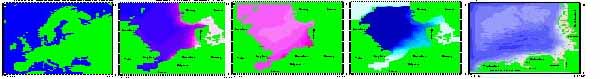
Additionally to these animation's VISUMOD offers opportunity to export data as a time-series on one grid point or as 2-dimensional arrays of the minimal and maximal value at each grid point or the mean and the standard deviation over the whole data-set. Naturally the program is not only able to calculate and export these data, it displays the results on the screen. To extract a time-series over one dataset, just choose the function FILE / SAVE TIMESERIE and click with the mouse on the data point on the screen. In this manner it is very easy to plot the shown parameter versus the time with your favorite plot program, like MATLAB, GRAPHER or ........ The next step is to add an interface to MATLAB to create the ready MATLAB plot files with VISUMOD.
The value of an actual parameter on a specific model grid point can be shown by pointing the mouse on the location during the animation. Additionally the program calculates the actual geographical position of the mouse pointer in degree and minutes of the corresponding grid point and the x,y location in model coordinates. During the animation the colormap and the speed can be changed and it is possible to show the topography of the underlying model.
 Statistic options
 A few statistic moments are build in the program to validate the data. If more statistic moments are necessary, contact me at rluff at gmx.de, there is no limit of adding additional functions, exept my time.
The program calculates the minimum or the maximum value of each data point of the whole dataset and displays the corresponding new data field. By moving the mouse into the "wet" areas of the model field, the min or max value of the model grid point under the mouse pointer is displayed.
The mean values of the dataset are calculated by using the standard mean formula :
The standard deviation values of the dataset are calculated by using the
formula :
 Back to the VISUMOD page